- Home

- Forest and Land use
Forest and Land use

Land Use
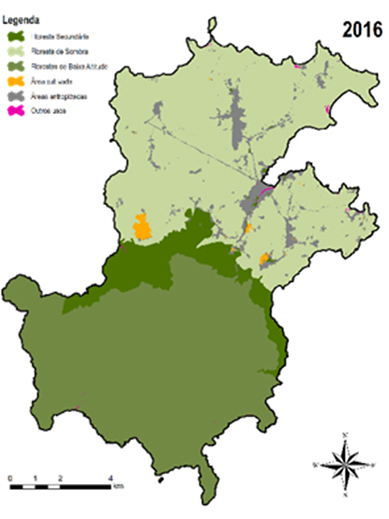
In order to understand the changes in land use, the analysis of satellite images was used after a sensory analysis of 2016 (base year) and 2020.
This analysis allows us to conclude that in 2016, about 95% of the total area of ARP was occupied by forest, divided into three forest typologies: Low Altitude Forest (43%), Shadow Forest (44%) and Secondary Forest (8%).
However, through the analysis of the images, it is possible to denote the loss of some forest areas to agricultural areas and urban settlements, reducing the percentage occupied by forest to 94%. In this way, the Shadow Forest was the forest area with a higher percentage of transformation in other land uses.
As explained in the methodology, through the analysis of satellite images from 2016 and 2020 it was possible to determine an evolution matrix of the land use that allowed, through computer software, to obtain a projection of changes in land use until 2050.
With population growth and economic development, it is natural that there is a need to transform forest areas into farms and human settlements. The evolution of the use of the forest for the João Dias Filho scenario is presented in detail in the side animation.
According to projections, in 2050, the forest in ARP will occupy approximately 87.5% of the total area of the region, which represents a reduction of 7.5% compared to 2016 and 6.5% compared to 2020.
Given this trend, it is necessary to minimize the conversion of forest areas into other uses in order to minimize GHG emissions and enhance their removals.
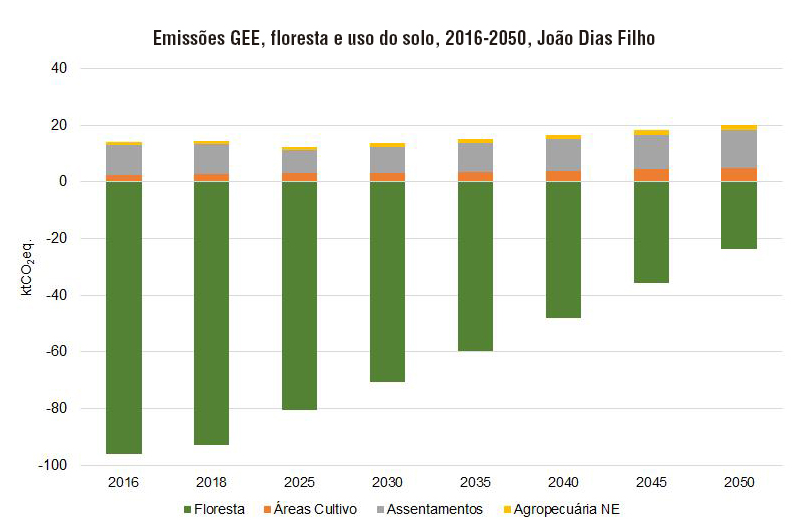
Forest and Land Use Emissions
In the João Dias Filho scenario, the projections point to an increase of 48% in the cultivated areas and agriculture and 22% in the settlements, in 2050, compared to the base year (2016). There was also a 75% reduction in carbon absorption capacity by forest areas in 2050.
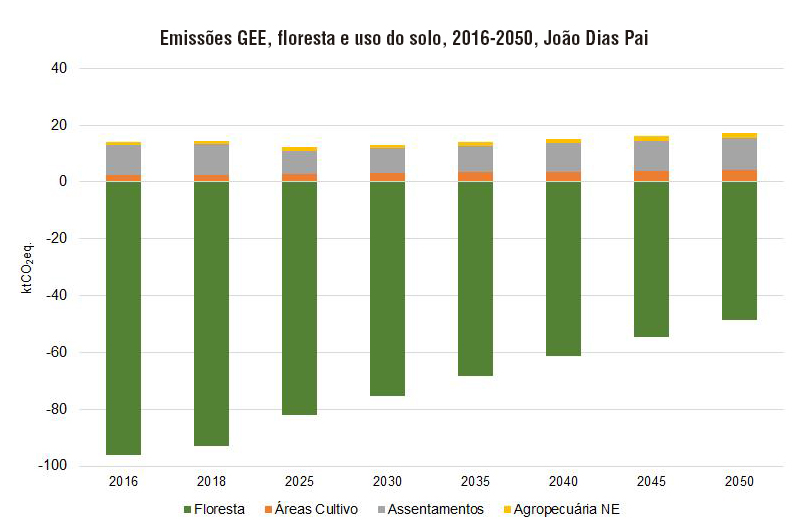
However, with the introduction of mitigation measures, in the João Dias Pai scenario, the increase in emissions, in 2050 compared to 2016, is minimized by moving to an increase of 38% in the cultivated areas, 48% in agriculture, and 8% in the settlements. The carbon absorption capacity decreased 49% when compared to 2016.